CONNEXION
  • RetourJeux
    • Sorties
    • Hit Parade
    • Les + populaires
    • Les + attendus
    • Soluces
    • Tous les Jeux
    • Gaming
  • RetourActu Gaming
    • News
    • Astuces
    • Tests
    • Previews
    • Toute l'actu gaming
  • RetourBons plans
    • Bons plans
    • Bons plans Smartphone
    • Bons plans Hardware
    • Bons plans Image et Son
    • Bons plans Amazon
    • Bons plans Cdiscount
    • Bons plans Decathlon
    • Bons plans Fnac
    • Tous les Bons plans
  • RetourJVTech
    • Actus High-Tech
    • Intelligence Artificielle
    • Smartphones
    • Mobilité urbaine
    • Hardware
    • Image et son
    • Tutoriels
    • Tests produits High-Tech
    • Guides d'achat High-Tech
    • JVTech
  • RetourCulture
    • Actus Culture
    • Culture
  • RetourVidéos
    • A la une
    • Gaming Live
    • Vidéos Tests
    • Vidéos Previews
    • Gameplay
    • Trailers
    • Chroniques
    • Replay Web TV
    • Toutes les vidéos
  • RetourForums
    • Hardware PC
    • PS5
    • Switch 2
    • Xbox Series
    • Switch
    • Pokemon pocket
    • FC 25 Ultimate Team
    • League of Legends
    • Tous les Forums
  • PC
  • PS5
  • Xbox Series
  • Switch 2
  • PS4
  • One
  • Switch
  • iOS
  • Android
  • MMO
  • RPG
  • FPS
En ce moment Genshin Impact Valhalla Breath of the wild Animal Crossing GTA 5 Red dead 2
Liste des sujets

[GNUPLOT] Modifier la légende associée à un graphique

PhilippeGerbier
PhilippeGerbier
Niveau 10
13 avril 2019 à 15:00:15

Bonjour, j'ai cherché partout et vraiment je patauge si des gens peuvent m'aider :(

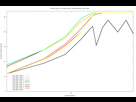
Mon graphique: https://image.noelshack.com/fichiers/2019/15/6/1555160226-moy.png
Mon script:

set terminal png size 1500,1000
set output "moy.png"

set title "Nb Bits perdus en moyenne par conditionnement et par algo."
set xlabel "conditionnement"
set ylabel "nb moyen de bits perdus"
set logscale x
set xrange [3:32]
set yrange [0:54]
set key left bottom

plot 'moy.data' index 0 with lines linewidth 3 linecolor rgb "grey" ,\
'moy.data' index 1 with lines linewidth 3 linecolor rgb "orange" ,\
'moy.data' index 2 with lines linewidth 3 linecolor rgb "purple",\
'moy.data' index 3 with lines linewidth 3 linecolor rgb "blue",\
'moy.data' index 4 with lines linewidth 3 linecolor rgb "green",\
'moy.data' index 5 with lines linewidth 3 linecolor rgb "red",\
'moy.data' index 6 with lines linewidth 3 linecolor rgb "black",\
'moy.data' index 7 with lines linewidth 3 linecolor rgb "brown",\
'moy.data' index 8 with lines linewidth 3 linecolor rgb "yellow"

Je voudrais qu'a chaque fois que j'affiche un graphe (tous ce qu'il y a aprés le plot pour chaque 'mo.data' index i) choisir comment j'appelerais le graph sur la légende et pas juste 'moy data' index i :(

Merci à vous

godrik
godrik
Niveau 30
13 avril 2019 à 17:04:29

ajoute :
t "montitre"
avant chaque virgule

Sous forums
  • Aide à l'achat Mac
  • Création de sites web
  • Internet
  • Macintosh
  • Création de Jeux
  • Linux
  • Programmation
  • Steam Deck
  • Hardware
La vidéo du moment