[Script] ici on partage nos scripts

study(title="Relative Strength Index", shorttitle="RSI", scale=scale.right, precision=1)
src = input(close, title="Source")

// RSI
lengthRSI = input(21, minval=1, title="RSI period")
up = rma(max(change(src), 0), lengthRSI)
down = rma(-min(change(src), 0), lengthRSI)
rsi = down == 0 ? 100 : up == 0 ? 0 : 100 - (100 / (1 + up / down))

// RSI Background, Mid point, and upper & lower bands
hline(50, title="Level 50 line", color=color(white, 70), linestyle=dotted, linewidth=1)
ResistanceRSI = hline(70, title="RSI resistance", color=color(white, 70), linestyle=dashed, linewidth=1)
ResistanceRSI1 = hline(60, title="RSI resistance 1", color=color(white,70), linestyle=dashed, linewidth=1)
SupportRSI = hline(40, title="RSI support", color=color(white, 70), linestyle=dashed, linewidth=1)
SupportRSI1 = hline(30, title="RSI support 1", color=color(white, 70), linestyle=dashed, linewidth=1)
fill(ResistanceRSI,SupportRSI,color=purple, title="RSI Background", transp=90)


// RSI Line
plot(rsi, color= color(yellow, 0), style=line, title="RSI", linewidth=2)
Pour ceux qui ne comprennent pas, ce script ajoute au RSI (Relative Strenght Index) des lignes droites tracées et ajustables autre que les deux seuls du RSI par défaut "bande supérieur" & "inférieur", elle simplifie donc la vie à ceux qui utilisent beaucoup le RSI non combiné avec d'autres indicateurs sur le même volet et qui choppent la flemme de retracer des droites avec la précision d'une souris.
screen par exemple;
Rsi intégré:
Script RSI:
Voilà le rendu: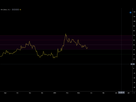
je sais que ça n'est absolument rien mais je partage, n'hésitez pas à faire de même 

Cool merci
Tu sais comment ajouter des MA au RSI ?
Le 23 mars 2019 à 15:20:42 Nosferaatuu a écrit :
Cool merci
Tu sais comment ajouter des MA au RSI ?
Non, j'ai du mal à les intégrer au RSI, je les posterai une fois que j'ai la solution, en attendant je peux proposer un script incluant 9MM (3ma 3mmExpo 3mmPondéré) ou seulement 3 au choix voir plus mais intégré au cours 
Le 23 mars 2019 à 15:35:46 CodeurAlgerien a écrit :
Le 23 mars 2019 à 15:20:42 Nosferaatuu a écrit :
Cool merci
Tu sais comment ajouter des MA au RSI ?Non, j'ai du mal à les intégrer au RSI, je les posterai une fois que j'ai la solution, en attendant je peux proposer un script incluant 9MM (3ma 3mmExpo 3mmPondéré) ou seulement 3 au choix voir plus mais intégré au cours
Ouais je veux bien
Le 23 mars 2019 à 15:42:03 Nosferaatuu a écrit :
Le 23 mars 2019 à 15:35:46 CodeurAlgerien a écrit :
Le 23 mars 2019 à 15:20:42 Nosferaatuu a écrit :
Cool merci
Tu sais comment ajouter des MA au RSI ?Non, j'ai du mal à les intégrer au RSI, je les posterai une fois que j'ai la solution, en attendant je peux proposer un script incluant 9MM (3ma 3mmExpo 3mmPondéré) ou seulement 3 au choix voir plus mais intégré au cours
Ouais je veux bien
MA x3 (Arithmétique)
ma1_color = #00ffff
ma2_color = #ff9800
ma3_color = #cc4125
ma1_p=input(8, title="Moyenne1 Longueur", type=integer)
ma2_p=input(13, title="Moyenne 2 Longueur", type=integer)
ma3_p=input(41, title="Moyenne 3 Longueur", type=integer)
ma1 = sma(close,ma1_p)
ma2 = sma(close,ma2_p)
ma3 = sma(close,ma3_p)
//Plot les MM
plot(ma1,color = ma1_color, linewidth = 2)
plot(ma2,color = ma2_color, linewidth = 2)
plot(ma3,color = ma3_color, linewidth = 2)
MM x 9 (3 arith 3 expo 3 pond)
study(title="MM x9",overlay=true)
ma1_color = #00ffff
ma2_color = #ff9800
ma3_color = #cc4125
mme1_color = #00ff00
mme2_color = #000080
mme3_color = #008080
mmp1_color = #ff3366
mmp2_color = #00cc66
mmp3_color = #00cc90
ma1_p=input(20, title="Moyenne1 Long", type=integer)
ma2_p=input(115, title="Moyenne 2 Long", type=integer)
ma3_p=input(200, title="Moyenne 3 Long", type=integer)
mme1_p=input(200, title="Exponentielle 1 Long", type=integer)
mme2_p=input(250, title="Exponentielle 2 Long", type=integer)
mme3_p=input(300, title="Exponentielle 3 Long", type=integer)
mmp1_p=input(500, title="Ponderée 1 Long", type=integer)
mmp2_p=input(700, title="Ponderée 2 Long", type=integer)
mmp3_p=input(900, title="Pondere 3 Long", type=integer)
ma1 = sma(close,ma1_p)
ma2 = sma(close,ma2_p)
ma3 = sma(close,ma3_p)
mme1 = ema(close,mme1_p)
mme2 = ema(close,mme2_p)
mme3 = ema(close,mme3_p)
mmp1 = wma(close,mmp1_p)
mmp2 = wma(close,mmp2_p)
mmp3 = wma(close,mmp3_p)
plot(ma1,color = ma1_color, linewidth = 2)
plot(ma2,color = ma2_color, linewidth = 2)
plot(ma3,color = ma3_color, linewidth = 2)
plot(mme1,color = mme1_color, linewidth = 2)
plot(mme2,color = mme2_color, linewidth = 2)
plot(mme3,color = mme3_color, linewidth = 2)
plot(mmp1,color = mmp1_color, linewidth = 2)
plot(mmp2,color = mmp2_color, linewidth = 2)
plot(mmp3,color = mmp3_color, linewidth = 2)
Le 23 mars 2019 à 15:54:03 CodeurAlgerien a écrit :
Le 23 mars 2019 à 15:42:03 Nosferaatuu a écrit :
Le 23 mars 2019 à 15:35:46 CodeurAlgerien a écrit :
Le 23 mars 2019 à 15:20:42 Nosferaatuu a écrit :
Cool merci
Tu sais comment ajouter des MA au RSI ?Non, j'ai du mal à les intégrer au RSI, je les posterai une fois que j'ai la solution, en attendant je peux proposer un script incluant 9MM (3ma 3mmExpo 3mmPondéré) ou seulement 3 au choix voir plus mais intégré au cours
Ouais je veux bien
MA x3 (Arithmétique)
ma1_color = #00ffff
ma2_color = #ff9800
ma3_color = #cc4125ma1_p=input(8, title="Moyenne1 Longueur", type=integer)
ma2_p=input(13, title="Moyenne 2 Longueur", type=integer)
ma3_p=input(41, title="Moyenne 3 Longueur", type=integer)ma1 = sma(close,ma1_p)
ma2 = sma(close,ma2_p)
ma3 = sma(close,ma3_p)//Plot les MM
plot(ma1,color = ma1_color, linewidth = 2)
plot(ma2,color = ma2_color, linewidth = 2)
plot(ma3,color = ma3_color, linewidth = 2)MM x 9 (3 arith 3 expo 3 pond)
study(title="MM x9",overlay=true)
ma1_color = #00ffff
ma2_color = #ff9800
ma3_color = #cc4125
mme1_color = #00ff00
mme2_color = #000080
mme3_color = #008080
mmp1_color = #ff3366
mmp2_color = #00cc66
mmp3_color = #00cc90ma1_p=input(20, title="Moyenne1 Long", type=integer)
ma2_p=input(115, title="Moyenne 2 Long", type=integer)
ma3_p=input(200, title="Moyenne 3 Long", type=integer)
mme1_p=input(200, title="Exponentielle 1 Long", type=integer)
mme2_p=input(250, title="Exponentielle 2 Long", type=integer)
mme3_p=input(300, title="Exponentielle 3 Long", type=integer)
mmp1_p=input(500, title="Ponderée 1 Long", type=integer)
mmp2_p=input(700, title="Ponderée 2 Long", type=integer)
mmp3_p=input(900, title="Pondere 3 Long", type=integer)ma1 = sma(close,ma1_p)
ma2 = sma(close,ma2_p)
ma3 = sma(close,ma3_p)
mme1 = ema(close,mme1_p)
mme2 = ema(close,mme2_p)
mme3 = ema(close,mme3_p)
mmp1 = wma(close,mmp1_p)
mmp2 = wma(close,mmp2_p)
mmp3 = wma(close,mmp3_p)plot(ma1,color = ma1_color, linewidth = 2)
plot(ma2,color = ma2_color, linewidth = 2)
plot(ma3,color = ma3_color, linewidth = 2)
plot(mme1,color = mme1_color, linewidth = 2)
plot(mme2,color = mme2_color, linewidth = 2)
plot(mme3,color = mme3_color, linewidth = 2)
plot(mmp1,color = mmp1_color, linewidth = 2)
plot(mmp2,color = mmp2_color, linewidth = 2)
plot(mmp3,color = mmp3_color, linewidth = 2)
ça fonctionne 
Merci chef 
fill(ResistanceRSI,SupportRSI1,color=purple, title="RSI Background", transp=90)
c'est mieux comme ça non ? sinon le background est uniquement entre 70 et 40, au lieu de 70 - 30
Je pense avoir réussi l'intégration des MA sur le RSI
// Dédi aux khey du 18-25
// Auteur: CodeurAlgerien
study(title="Relative Strength Index", shorttitle="RSI", scale=scale.right, precision=1)
src = input(close, title="Source")
// RSI
lengthRSI = input(21, minval=1, title="RSI period")
up = rma(max(change(src), 0), lengthRSI)
down = rma(-min(change(src), 0), lengthRSI)
rsi = down == 0 ? 100 : up == 0 ? 0 : 100 - (100 / (1 + up / down))
// RSI Background, Mid point, and upper & lower bands
hline(50, title="Level 50 line", color=color(white, 70), linestyle=dotted, linewidth=1)
ResistanceRSI = hline(70, title="RSI resistance", color=color(white, 70), linestyle=dashed, linewidth=1)
ResistanceRSI1 = hline(60, title="RSI resistance 1", color=color(white,70), linestyle=dashed, linewidth=1)
SupportRSI = hline(40, title="RSI support", color=color(white, 70), linestyle=dashed, linewidth=1)
SupportRSI1 = hline(30, title="RSI support 1", color=color(white, 70), linestyle=dashed, linewidth=1)
fill(ResistanceRSI,SupportRSI,color=purple, title="RSI Background", transp=90)
// RSI Line
plot(rsi, color= color(yellow, 0), style=line, title="RSI", linewidth=2)
//MA sur RSI
lensma1 = input(9, minval=1, title="RSI MA 1")
out1 = sma(rsi, lensma1)
col1=white
plot(out1, title="RSI MA1", color=col1, linewidth=2)
lensma2 = input(13, minval=1, title="RSI MA 2")
out2 = sma(rsi, lensma2)
col2=blue
plot(out2, title="RSI MA2", color=col2, linewidth=2)
lensma3 = input(41, minval=1, title="RSI MA 3")
out3 = sma(rsi, lensma3)
col3=red
plot(out3, title="RSI MA3", color=col3, linewidth=2)

Le 23 mars 2019 à 16:10:23 Aphe a écrit :
fill(ResistanceRSI,SupportRSI1,color=purple, title="RSI Background", transp=90)c'est mieux comme ça non ? sinon le background est uniquement entre 70 et 40, au lieu de 70 - 30
En effet, merci de m'avoir corrigé 
Le 23 mars 2019 à 16:11:39 CodeurAlgerien a écrit :
Je pense avoir réussi l'intégration des MA sur le RSI// Dédi aux khey du 18-25
// Auteur: CodeurAlgerienstudy(title="Relative Strength Index", shorttitle="RSI", scale=scale.right, precision=1)
src = input(close, title="Source")// RSI
lengthRSI = input(21, minval=1, title="RSI period")
up = rma(max(change(src), 0), lengthRSI)
down = rma(-min(change(src), 0), lengthRSI)
rsi = down == 0 ? 100 : up == 0 ? 0 : 100 - (100 / (1 + up / down))// RSI Background, Mid point, and upper & lower bands
hline(50, title="Level 50 line", color=color(white, 70), linestyle=dotted, linewidth=1)
ResistanceRSI = hline(70, title="RSI resistance", color=color(white, 70), linestyle=dashed, linewidth=1)
ResistanceRSI1 = hline(60, title="RSI resistance 1", color=color(white,70), linestyle=dashed, linewidth=1)
SupportRSI = hline(40, title="RSI support", color=color(white, 70), linestyle=dashed, linewidth=1)
SupportRSI1 = hline(30, title="RSI support 1", color=color(white, 70), linestyle=dashed, linewidth=1)
fill(ResistanceRSI,SupportRSI,color=purple, title="RSI Background", transp=90)// RSI Line
plot(rsi, color= color(yellow, 0), style=line, title="RSI", linewidth=2)//MA sur RSI
lensma1 = input(9, minval=1, title="RSI MA 1")
out1 = sma(rsi, lensma1)
col1=white
plot(out1, title="RSI MA1", color=col1, linewidth=2)lensma2 = input(13, minval=1, title="RSI MA 2")
out2 = sma(rsi, lensma2)
col2=blue
plot(out2, title="RSI MA2", color=col2, linewidth=2)lensma3 = input(41, minval=1, title="RSI MA 3")
out3 = sma(rsi, lensma3)
col3=red
plot(out3, title="RSI MA3", color=col3, linewidth=2)
cimer chef
Le 23 mars 2019 à 16:11:39 CodeurAlgerien a écrit :
Je pense avoir réussi l'intégration des MA sur le RSI// Dédi aux khey du 18-25
// Auteur: CodeurAlgerienstudy(title="Relative Strength Index", shorttitle="RSI", scale=scale.right, precision=1)
src = input(close, title="Source")// RSI
lengthRSI = input(21, minval=1, title="RSI period")
up = rma(max(change(src), 0), lengthRSI)
down = rma(-min(change(src), 0), lengthRSI)
rsi = down == 0 ? 100 : up == 0 ? 0 : 100 - (100 / (1 + up / down))// RSI Background, Mid point, and upper & lower bands
hline(50, title="Level 50 line", color=color(white, 70), linestyle=dotted, linewidth=1)
ResistanceRSI = hline(70, title="RSI resistance", color=color(white, 70), linestyle=dashed, linewidth=1)
ResistanceRSI1 = hline(60, title="RSI resistance 1", color=color(white,70), linestyle=dashed, linewidth=1)
SupportRSI = hline(40, title="RSI support", color=color(white, 70), linestyle=dashed, linewidth=1)
SupportRSI1 = hline(30, title="RSI support 1", color=color(white, 70), linestyle=dashed, linewidth=1)
fill(ResistanceRSI,SupportRSI,color=purple, title="RSI Background", transp=90)// RSI Line
plot(rsi, color= color(yellow, 0), style=line, title="RSI", linewidth=2)//MA sur RSI
lensma1 = input(9, minval=1, title="RSI MA 1")
out1 = sma(rsi, lensma1)
col1=white
plot(out1, title="RSI MA1", color=col1, linewidth=2)lensma2 = input(13, minval=1, title="RSI MA 2")
out2 = sma(rsi, lensma2)
col2=blue
plot(out2, title="RSI MA2", color=col2, linewidth=2)lensma3 = input(41, minval=1, title="RSI MA 3")
out3 = sma(rsi, lensma3)
col3=red
plot(out3, title="RSI MA3", color=col3, linewidth=2)

Sympa, je fav au cas où il y aurait quelque chose d'intéressant pour moi
up